HPC Toolkit
Overview
Tutorial: 45 min
- Objectives:
Understand the basics of HPC Toolkit and how to use it for profiling applications.
HPC Toolkit is a suite of tools for performance analysis and optimization HPC applications. It provides detailed insights into the performance characteristics of parallel applications, helping developers identify bottlenecks and optimize their code for better performance.
Build the application LULESH using the following command:
1cd /scratch/vp91/$USER
2git clone https://github.com/LLNL/LULESH.git
3
4cd /scratch/vp91/$USER/intro-to-profiling/build_scripts
5./build_lulesh_hpctoolkit.sh /scratch/vp91/$USER/LULESH
Now we will run LULESH with HPC Toolkit to collect performance data. Use the following PBS job script to submit the job:
1cd /scratch/vp91/$USER/intro-to-profiling/job_scripts/hpctoolkit/
2qsub 1_lulesh.pbs
The job script runs the application under hpcrun, which samples the execution and writes a
measurements directory named hpctoolkit-lulesh2.0-measurements-*. (For source-level attribution
you can optionally run hpcstruct on the lulesh2.0 binary to produce a program-structure file,
which hpcprof will pick up automatically.)
Once the job is complete, you will find the performance data in the measurements directory generated by HPC Toolkit, named hpctoolkit-lulesh2.0-measurements-*.
HPC Profiler
To analyze the collected performance data, use the following command:
1hpcprof <hpctoolkit-lulesh2.0-measurements-*>
This will generate a performance database, hpctoolkit-lulesh2.0-database-*, that can be viewed using the HPC Toolkit’s visualization tools.
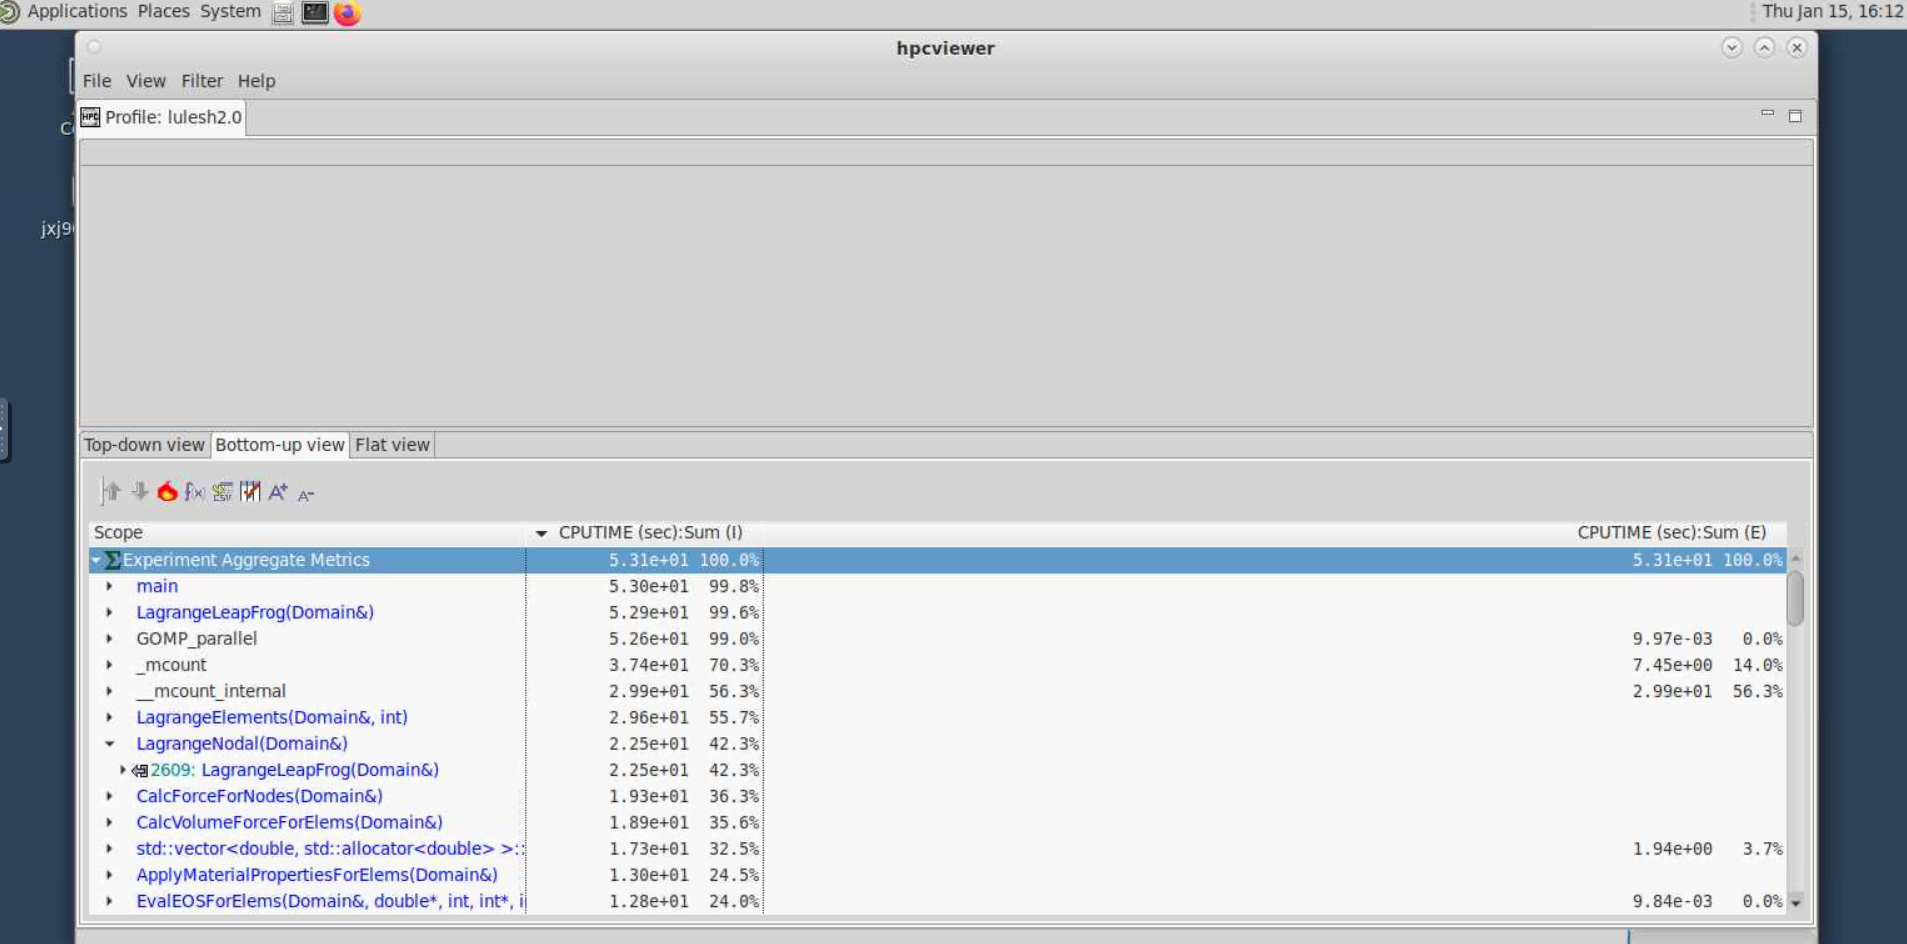
HPC Viewer
1module load hpcviewer/2021.05.15
2
3hpcviewer <hpctoolkit-lulesh2.0-database-*>
On Gadi this will usualy result in an error due to missing display. To get around this, launch a Virtual Desktop session on Gadi and run the above command in the terminal available on the Virtual Desktop.
Once launched you can explore the performance data using the various views and analysis tools provided by HPC Toolkit. Look for hotspots, communication overheads, and other performance metrics to identify areas for optimization in your application.
Key Points
HPC Toolkit is a powerful tool for profiling and analyzing the performance of HPC applications.
It provides detailed insights into application performance, helping identify bottlenecks and optimization opportunities.
Visualization tools like HPC Viewer allow for easy exploration of performance data.